Visual Decision Data Analysis
Jul 1, 2023
·
1 min read
Rangel Neuroeconomics Lab · Data Analysis · 2023
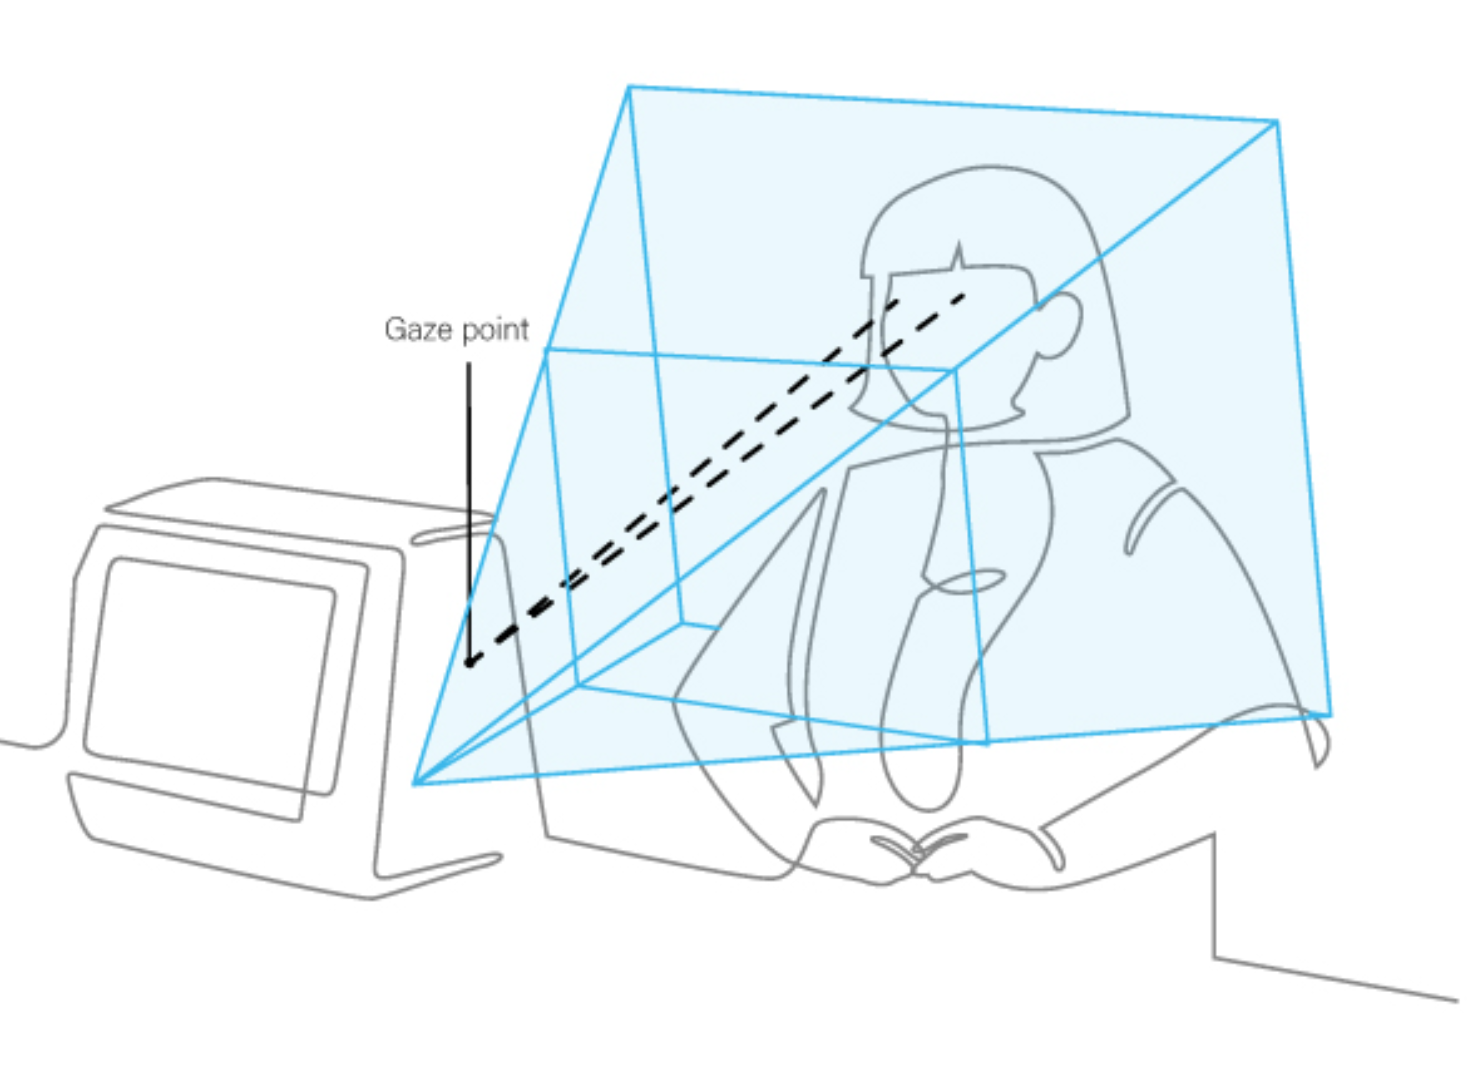
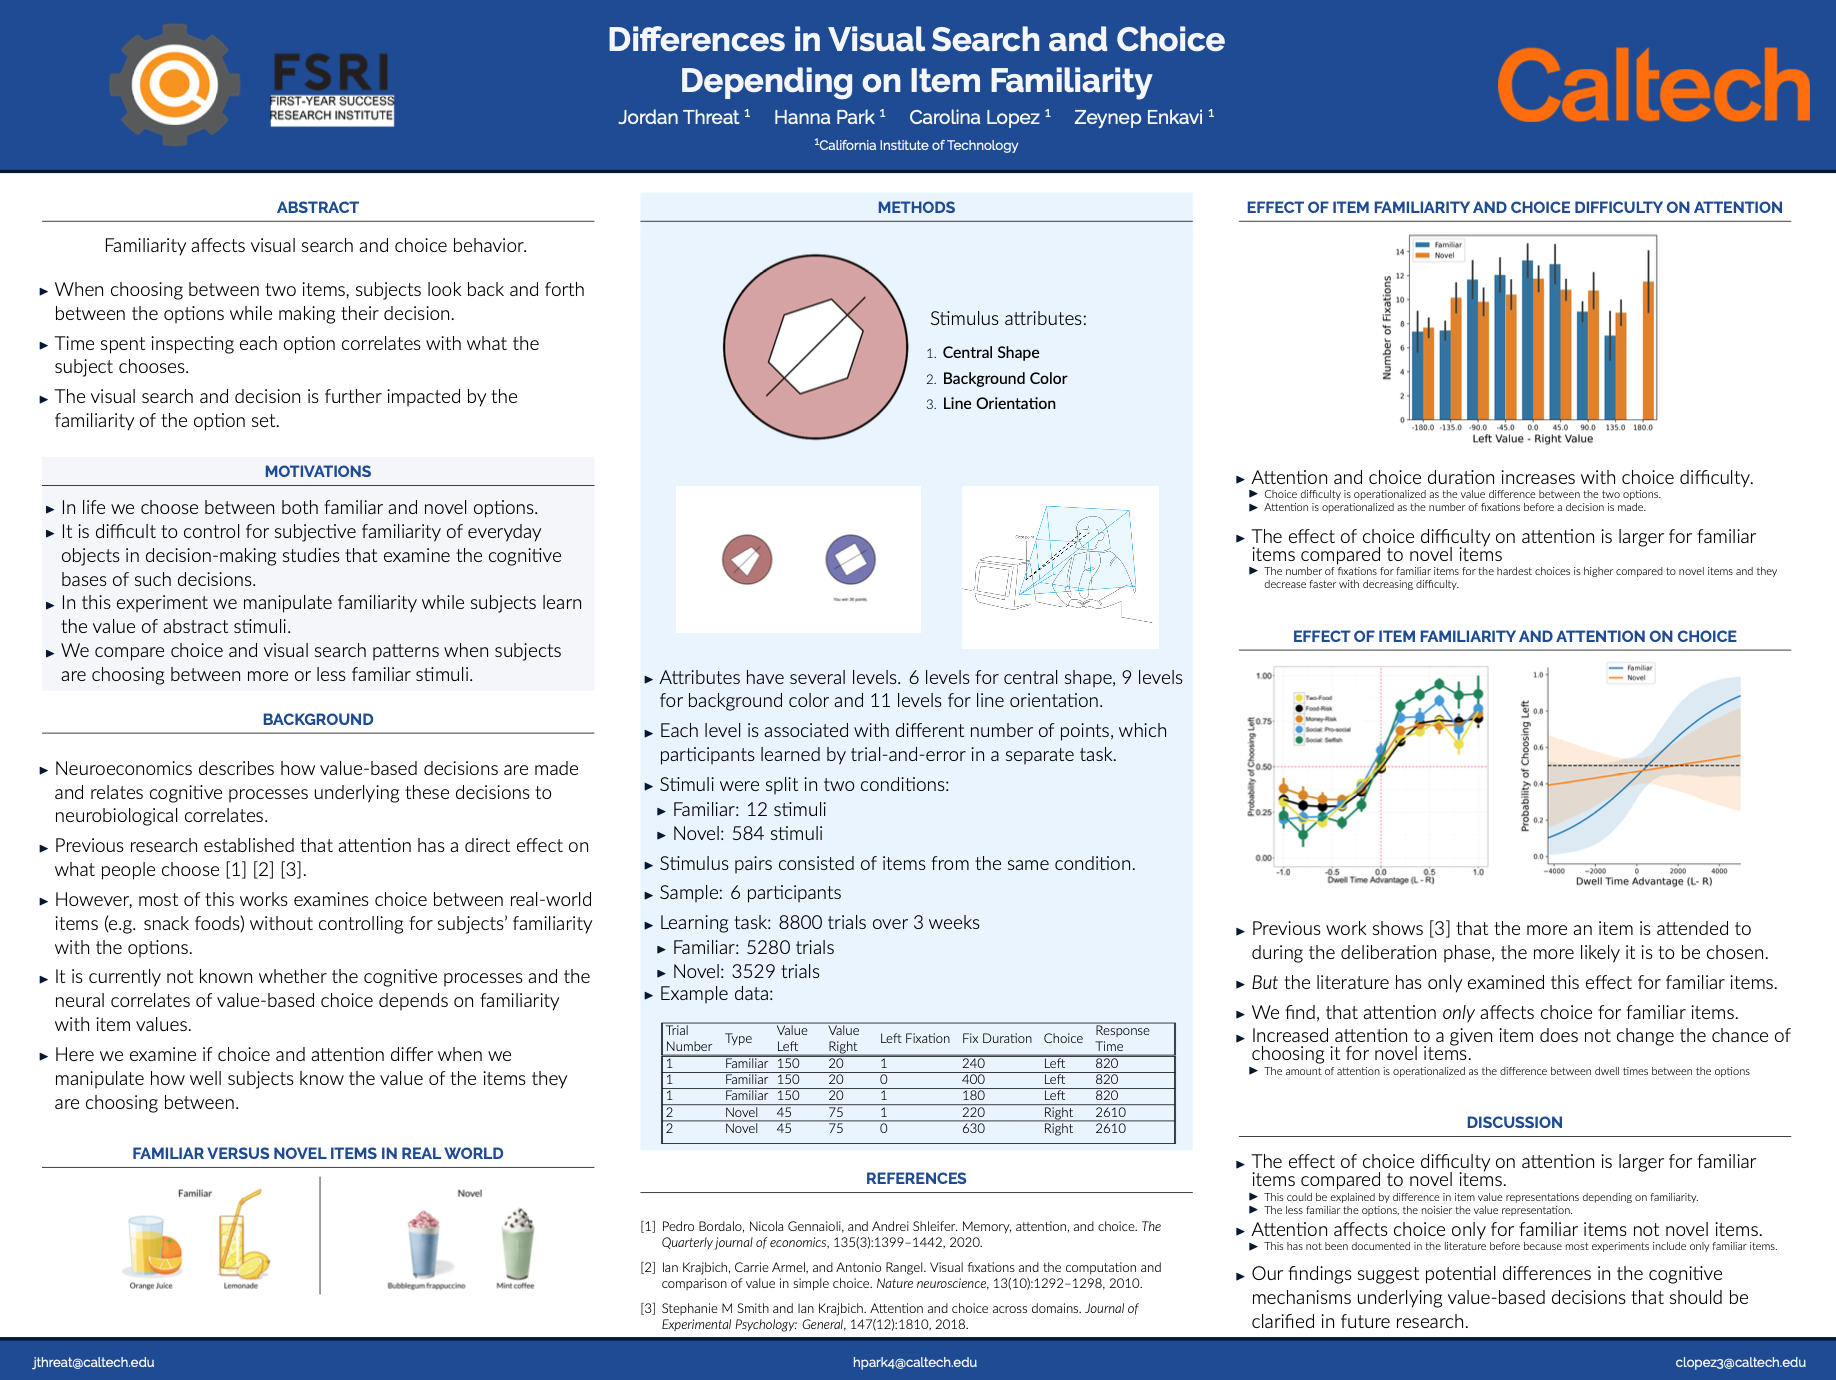
I analyzed behavioral and eye-tracking data from a visual search and choice experiment, using Python and regression analysis to study how item familiarity and attention affected decision behavior.
Python
Pandas
Matplotlib
Regression analysis
Data visualization
Behavioral data
Eye-tracking data
Research poster
Project Work
This was my first research experience at Caltech through its First-Year Success Research Institute (FSRI) in the Rangel Neuroeconomics Laboratory. I cleaned and organized behavioral data, used Python for analysis and plotting, applied regression analysis to study attention and choice difficulty, and compared familiar versus novel item behavior. I presented the work through a research symposium and poster session.
Poster
Research poster
Differences in Visual Search and Choice Based on Item Familiarity

Authors
Mechanical Engineering Student
I am a mechanical engineering student at Caltech interested in robotics, controls,
aerial systems, and multi-modal robot platforms. My work focuses on building and
testing physical robotic systems through flight-control integration, prototyping,
aerodynamic testing, sensing, and experimental validation.